

If you’ve been following this Substack, you’ve seen the experimental levels I post each morning. These aren’t forecasts. They’re structural markers based on how the market tends to behave.
While still early-stage and freely shared, these levels have shown meaningful alignment with intraday reactions, especially in 0DTE setups, mean-reversion trades, and breakout zones.
So why do markets respect certain price levels again and again? Why do reactions often occur with near-mechanical precision?
Here’s a deeper look at the structural forces at play and why some levels act like magnets, traps, or turning points.
Markets Often Have a Destination in Mind
Here’s a recurring observation:
Markets often behave like machines driving toward a specific target. Once that level is reached, momentum fades, volatility picks up, and we often see an overreaction or reversal. Then the cycle starts again.
This pattern shows up frequently. Daily 0DTE moves tend to resolve into key strikes. Weekly activity often clusters around prior highs or major open interest zones. Broader trends accelerate into macro-level reference points like quarterly VWAPs or previous all-time highs. It’s not always perfect, but it’s consistent enough to study and trade.
Six Forces That Make Levels Work
1. Algorithmic Trading (35%)
A large majority of U.S. equity volume, often cited in the range of 60 to 80 percent, is executed by algorithmic systems. These systems follow logic-based instructions, not discretionary analysis. For example:
A breakout strategy might trigger buys above a prior high
Mean reversion algos may scale into VWAP deviations
Execution algos like VWAP or TWAP slice orders over time intervals
When multiple strategies converge around the same levels, the result is visible: spikes in volume, sharp pivots, or price sticking to a zone for hours.
2. Technical Anchoring (25%)
Support and resistance, prior highs and lows, trendlines, moving averages, and VWAPs are among the most consistently referenced anchors in trading.
Even institutional systems often incorporate technical inputs. Common intraday behavior includes:
Hesitation near the previous day's close or VWAP
Reactions at common retracement levels like 38.2 or 61.8 percent
Consolidation below prior resistance zones before continuation
These levels create inflection points not because they predict, but because they are widely referenced and embedded into trade execution logic.
3. Market Structure (20%)
Some levels are created not by price history but by the way the market functions.
On monthly options expiration, SPX frequently drifts toward strikes with large gamma exposure
Index rebalances and ETF flows can cause directional pressure or pinning
Auction imbalances and settlement flows influence price during the open and close
During quarterly expirations, index prices often stall near major strikes as dealers hedge exposure and liquidity clusters around those levels.
4. Liquidity and Order Flow (15%)
Large institutional trades are executed gradually using algorithms. These execution tools prioritize volume efficiency and minimal slippage, leading to:
Price stabilizing around high-volume zones
Intraday pullbacks often reacting at or near VWAP
Sudden moves through illiquid areas when order books thin out
These forces don’t predict direction, but they do shape where and how price moves.
5. Behavioral Feedback Loops (3%)
Major economic reports or surprise headlines often trigger strong reactions. These reactions may temporarily override structural setups, but price frequently returns to key reference zones afterward.
For instance, we’ve seen many econ releases, ES initially dropped more than 30 points before retracing back to its pre-report VWAP area within the same session. This pattern of overshoot and reversion is common.
6. Psychological Anchoring (2%)
Even in automated markets, human behavior leaves a footprint. Traders often anchor to:
Round numbers like 5000, 5200, or 5300 on SPX
Prior all-time highs or recent gap fills
Visually clean trendlines or breakout zones
These levels don’t hold because of inherent value. They hold because many people watch and react to them, creating short-term supply and demand imbalances.
Yearly Rhythms and Market Echoes
On a longer timescale, markets display recurring structure. Trends build, extend, and exhaust into key areas. Volatility rises at turning points. Certain sequences tend to repeat, even across different years.
This long-term chart of the NYSE Composite Index helps illustrate the point:
From 1965 to 2025, major expansions and corrections tend to complete themselves at structured levels. Each multi-year run finds a ceiling, resets, and starts again. The cycles vary in size and duration, but the shape often rhymes. It reflects how capital flows, expectations build, and machines eventually exhaust their targets.
Even the volatility patterns in the ARMS Index below the chart show consistent rhythm. There’s a recurring cadence in how markets compress, break, and revert. Understanding this rhythm is key to identifying when levels matter most

What This Means for Readers
The levels shared on this Substack are rooted in the six forces above. They are not predictions. They are behavioral and structural reference points.
If you’re trading intraday, using 0DTE strategies, or looking for better entry and exit logic, these levels can offer useful context. They help filter noise and focus attention where reactions are most likely.
This project is still evolving, but the early signal has been encouraging for automation.
Still Experimental, Still Worth Watching
This Substack is a live research notebook. The levels I post are generated by models I continue to refine and test. Some days, the market respects them with surprising precision. Other days, it overshoots or whips through. But across weeks and months, patterns emerge.
Stick around if you're interested in structure-based trading, clean setups, and finding repeatable edges in a market that often feels chaotic but is far more mechanical than it appears.
thanks for reading. Enjoy your summer.
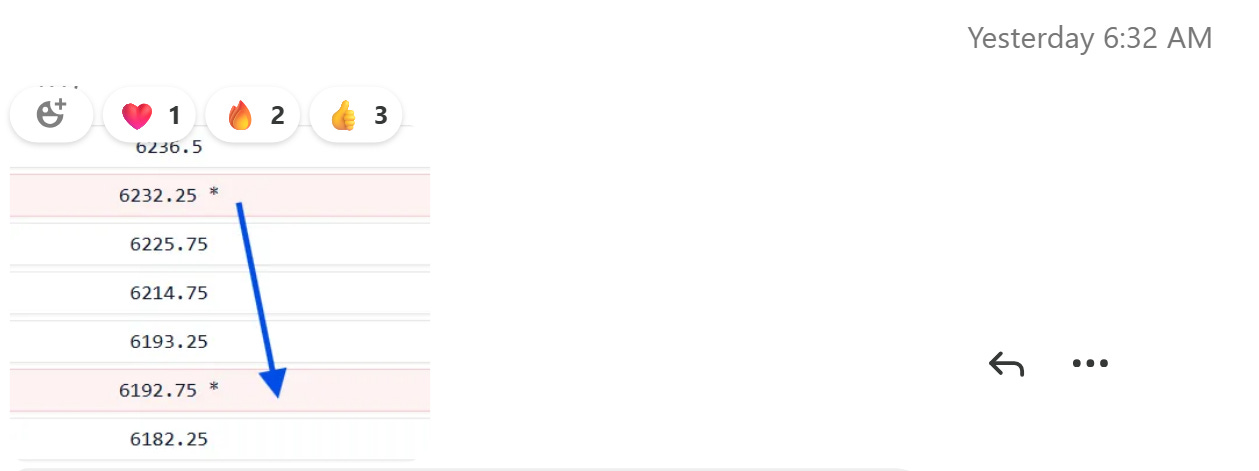
This was from friday..
At mkt open:
How it played out:
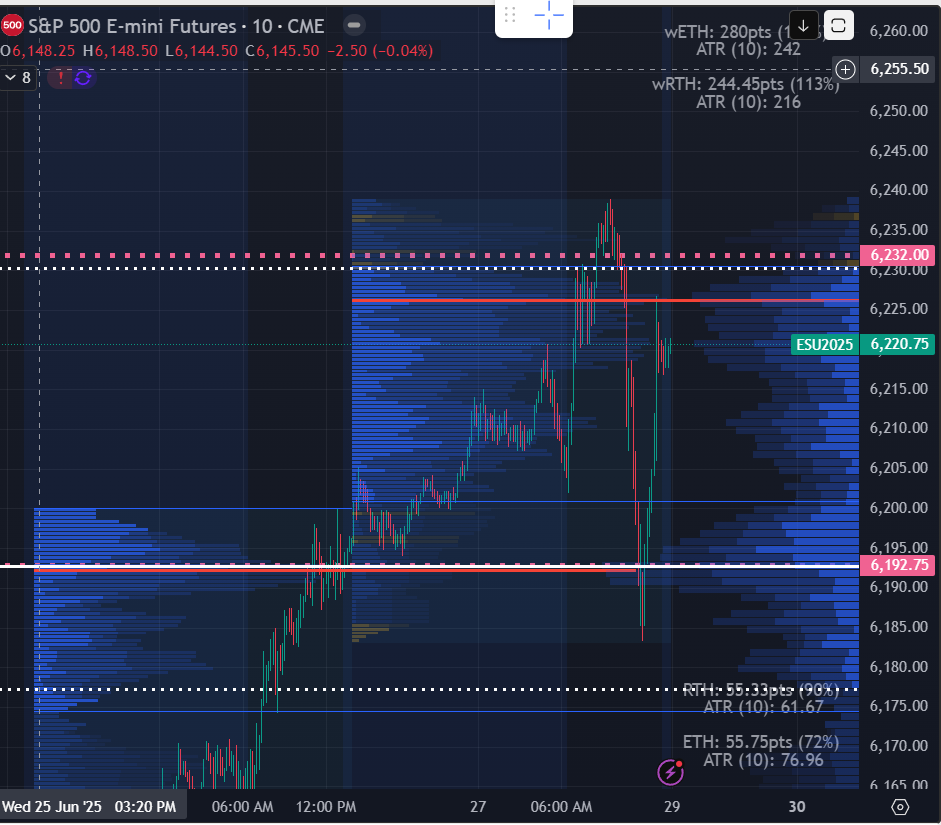
The volume profile view in TW is custom one i presume? Great article as usual, thanks for sharing